Two indicators.
One slot.
A free TradingView account gives you 2 indicators per chart. Run MACD and RSI separately and your chart is full. MACD-RSI Confluence fits both — plus divergence detection, RSI bands on price, and multi-timeframe confirmation — into a single slot.
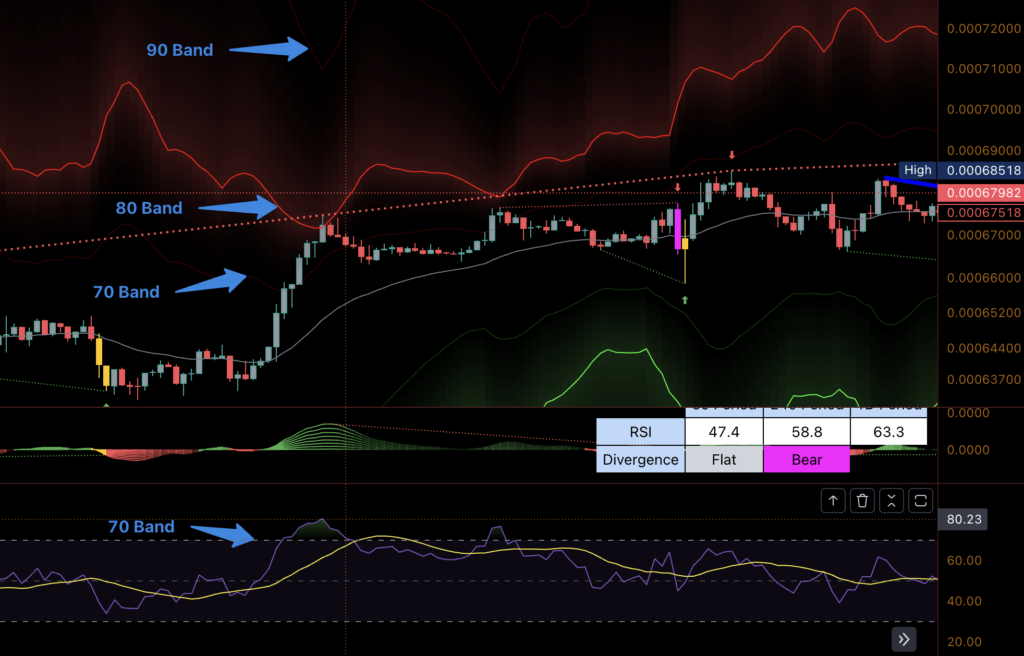
RSI bands on price, multi-timeframe table on the chart
The free plan gives you two slots
So the question isn't whether MACD and RSI are useful. It's what you give up to run them both.
MACD + RSI separately
- —Slot 1: MACD
- —Slot 2: RSI
- —0 slots left. No volume, no MAs, no support/resistance.
- —Two sub-panes eaten, price candles squeezed
- —Divergence spotted by eye, one timeframe at a time
MACD-RSI Confluence
- ✓Slot 1: MACD + RSI + divergence detection
- ✓Slot 2: yours again
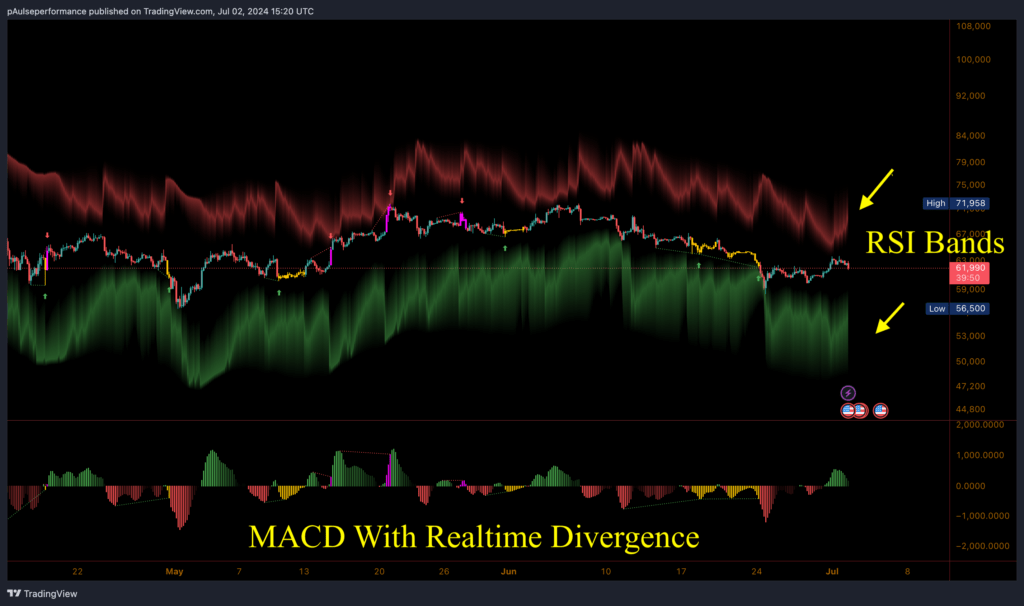
- ✓No sub-panes used — RSI bands sit on the price axis
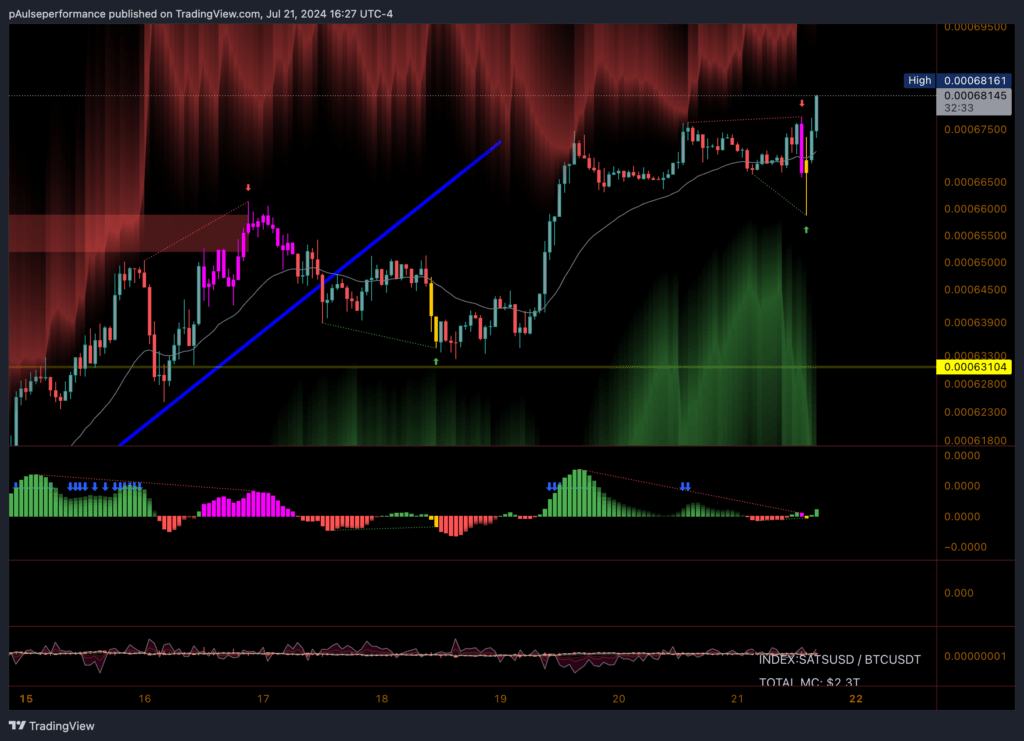
- ✓Candles highlight themselves when divergence fires
- ✓Three timeframes checked automatically, in one table
What's actually inside
RSI on price, not in a pane
Twelve RSI levels — 10 through 90 — projected onto the price axis. You read momentum and price in the same glance, and you reclaim the sub-pane.
Candles mark themselves
When MACD divergence is confirmed, the candles highlight. No label hunting, no scanning for arrows — the divergence is drawn where you're already looking.
Adaptive MACD lengths
Scalp mode holds fixed MACD periods for fast signals. Swing mode adapts MACD length to volatility as conditions change.
Three timeframes at once
Divergence and RSI checked on your chart timeframe plus two higher ones, with a status table showing where they agree.
Also included: full alert support on divergence and RSI extremes, configurable per timeframe · bullish and bearish divergence detection · six colour themes, including an auto-adaptive table that follows your chart background, a colour-blind-safe blue/orange mode and a high-impact Neon mode built for dark charts · works on every symbol and timeframe, including crypto and futures.
Watch it trade a replay session
A full Bar Replay session on BTCUSD 15-minute. The starting bar was picked with Select random bar — the menu is on screen in the opening seconds, so nobody chose a flattering entry point. Dead time between signals is sped up; every signal plays at normal speed so you can watch how price reacts.
On the chart
How access works
No downloads, no keys, no login. Three steps.
- 1
Buy, and give me your TradingView username
Checkout asks for the username on your TradingView account. That's the only thing I need from you — no email handshake, no forms afterwards.
- 2
Access is granted automatically
The moment payment completes, access is granted to that username by an automated system. Usually a few minutes, and you don't have to wait for me to be awake.
- 3
Accept once, keep forever
TradingView notifies you. Accept the invite and MACD-RSI Confluence is in your Invite-only scripts, on any chart, on any device you're logged into. Lifetime access.
MACD-RSI Confluence Lifetime Access
One payment. No subscription, no renewals.
Compare: TradingView Essential is $14.95/month — about $179/year — and the main thing most people buy it for is more indicator slots.
Get MACD-RSI Confluence — $99No card? Pay in crypto.
Send whatever coin you already hold — it converts and pays out to my own Monero address. No email, no name, no card. Your TradingView username is the only thing needed, and it is checked before you pay, so a typo costs you nothing. You get an account number in return — write it down, it is how you come back to this purchase.
One-time. Lifetime access, the same as the card checkout — no subscription either way. Access is granted to the TradingView username you type here.
Refund terms are set out in the refund policy. See also terms and disclaimer.
Questions
Get your chart back
MACD, RSI, divergence and multi-timeframe analysis in one indicator slot. $99, once.
Get MACD-RSI Confluence — $99Questions first? Email me.
MACD-RSI Confluence is a technical analysis tool. It is not financial advice, and it does not place trades or guarantee any outcome. Trading involves substantial risk of loss. Past chart behaviour does not predict future results. You are responsible for your own decisions.